Measurement
Reading ROAS vs. MER
Platform ROAS steers. MER keeps score. Why the two disagree, how to set breakeven targets from contribution margin, and when a holdout test is worth running.

Daan de Wit
Analytics Lead
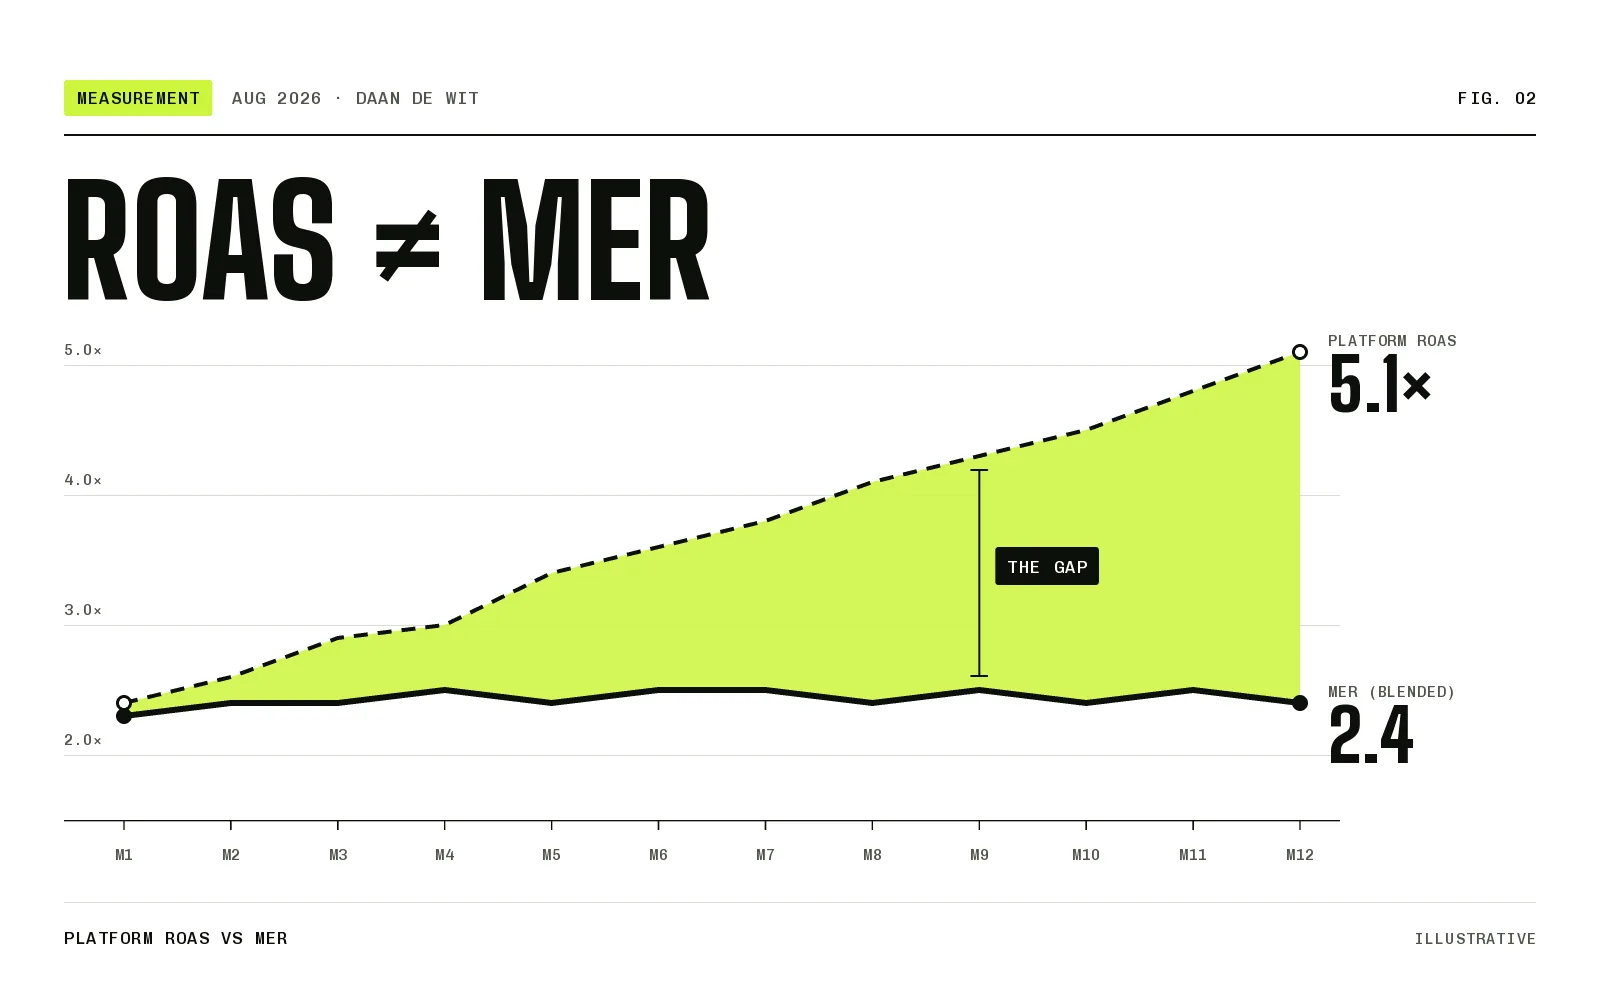
Your ads manager says 4.1 ROAS. Your finance lead says revenue barely moved. Both numbers can be correct, because they answer different questions. Using the wrong one for the wrong decision is how accounts overspend with a straight face.
What platform ROAS measures
Platform ROAS is revenue the platform attributes to its own ads, divided by spend on that platform.
“Attributes” is doing the work in that sentence. Each platform decides which conversions it gets credit for, using its own rules:
An attribution window: a conversion within a set number of days after a click, and often after a view, counts.
Its own data: pixel and server-side events, plus modeled conversions where tracking is incomplete.
Its own view of the customer: it can’t see the search, the email or the podcast that happened in between.
Every platform grades its own homework. That doesn’t make the number useless. It makes it a relative signal, not an absolute one.
What MER measures
MER (marketing efficiency ratio) is total revenue divided by total marketing spend, across every channel, for the same period.
It ignores attribution entirely, so it can’t be double counted. It includes revenue from organic, email, repeat customers and word of mouth. That’s both its strength and its weakness: it tells you whether marketing as a whole is paying off, but not which channel did it.
Pick a definition and keep it fixed. Decide whether spend includes creative production and agency fees, and whether revenue is gross or net of returns. Consistency matters more than the choice. Brands that depend on new customers should also track new-customer MER: first-order revenue ÷ total spend.
Why they disagree
Attribution windows. A platform using a 7-day click and 1-day view window credits sales that a last-click analytics report gives to another channel.
View-through credit. Someone scrolls past an ad, searches your brand two days later and buys. The social platform counts it. So does search.
Cross-channel double counting. Add up the revenue every platform claims and it often exceeds what your store actually took in. One order, three claims.
Organic and brand halo. Ads drive branded search, direct visits and marketplace sales. MER captures that. Platform ROAS mostly doesn’t.
Existing customers. Retargeting and branded search collect credit for people who were already on their way to buy.
How to use both
MER is the scoreboard. Set its target from your margins (below), review it weekly on a trailing 7- and 28-day basis, and judge total spend against it.
Platform ROAS is the steering wheel. Use it to compare campaigns, ad sets and creatives inside one platform, with the attribution setting held constant. It’s good at telling you which ad is better. It’s bad at telling you how much money you made.
Then connect the two. Each month, divide the revenue all platforms claim by your actual revenue. If platforms together claim 130% of real revenue, a platform ROAS of 3.0 is worth roughly 2.3 in reality. It’s a rough deflator, not the truth, but it keeps targets honest.
Breakeven ROAS and MER from contribution margin
Revenue targets mean nothing without margin. Here’s a worked example for one order:
Average order value: €80
Product cost: −€24
Shipping and fulfillment: −€10
Payment fees: −€2.40
Returns and discounts allowance: −€5.60
Contribution before marketing: €38, or 47.5% of revenue
Breakeven MER = 1 ÷ 0.475 = 2.1. Below that, every first order loses money. The same 2.1 is your breakeven ROAS for any single channel, in real revenue. In platform-reported terms, multiply by your claim ratio: at 130%, that’s about 2.7.
If you want 15% of revenue left after marketing, target MER = 1 ÷ (0.475 − 0.15) = 3.1. At €50k of spend, that’s €155k of revenue, €73.6k of contribution before marketing and €23.6k after.
Repeat purchases change the picture. If customers reliably buy again, you can accept a first-order MER below breakeven, as long as you name the payback window you’re willing to fund. In our Northdose demo case (illustrative figures; results vary), MER rose from 2.2 to 3.6 over eight months while CAC payback fell from 5.1 to 2.9 months.
When to run a holdout or geo test
Attribution models estimate. Holdouts measure. Run one when:
Platform ROAS and MER have pointed in opposite directions for a month or more.
You’re about to add a channel or make a large budget change.
A big share of claimed revenue comes from retargeting or branded search.
The simplest version is a geo holdout: pick matched regions, cut spend in some of them for three to six weeks, and compare revenue with the regions where ads kept running. Some platforms also offer built-in lift studies with audience holdouts.
The output is incremental ROAS: extra revenue caused by the ads ÷ spend. Say the regions with ads got €20k of spend and brought in €46k more revenue than the matched holdout regions. That’s an incremental ROAS of 2.3, against a platform-reported 3.8. The real return is about 40% below what the dashboard shows, and now you know how much to discount it.
If your ROAS and MER are telling different stories, our Growth Audit reconciles them against your margins.